
Regression
What is Regression? (A Simple Definition)
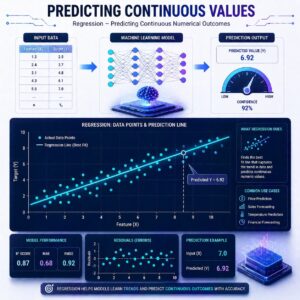
Regression is a type of Supervised Machine Learning used to predict a continuous number. While classification answers the question “What is it?”, regression answers the question “How much?” or “How many?”. It works by finding the mathematical relationship between your input features (the clues) and your target label (the number you want to predict).
The Algorithms: Step-by-Step
There are many ways a computer can calculate these predictions. Let’s look at three foundational algorithms.
1. Linear Regression
This is the simplest and most famous regression algorithm. Imagine you are plotting data on a graph for example, the size of a house on the bottom (X-axis) and its price on the side (Y-axis). Linear Regression acts like a student holding a ruler over those dots, trying to draw the straightest, most central line through the middle of them.
- How it works: It assumes the relationship between the features and the outcome is a straight line. As house size goes up, price goes up proportionally.
- The goal: To find the “Line of Best Fit” that makes the fewest mistakes when predicting the price based on the size.
2. The Problem of “Overfitting”
Before we look at the next two algorithms, we need to understand a common trap. In the real world, you don’t just use house size. You use size, age, number of bedrooms, distance to schools, and 50 other features. Sometimes, an algorithm tries too hard to connect all the dots perfectly during training. It creates a wild, squiggly mathematical line that memorizes the training data but completely fails when you give it new, real-world data. We call this overfitting.
3. Ridge & Lasso Regression (The Fixers)
To prevent overfitting, we use a technique called Regularization. This is just a fancy word for penalizing the model when it gets too complicated. Ridge and Lasso are two upgraded versions of Linear Regression that do exactly this.
- Ridge Regression: If the model is relying too heavily on certain features (like giving way too much importance to the color of the front door), Ridge steps in and mathematically “shrinks” the influence of those less important features. It keeps all the features, but makes sure none of them dominate the prediction unfairly.
- Lasso Regression: Lasso is a bit more ruthless. Instead of just shrinking the influence of useless features, it can reduce their importance to absolute zero. It essentially deletes useless features from the equation, leaving you with a simpler, cleaner model.
Practical Use Cases
Regression is the powerhouse behind many business decisions today:
-
- Price Prediction: Real estate platforms use regression to estimate property values based on square footage, location, and historical sales. Ride-sharing apps use it to predict fare prices based on distance, time of day, and current traffic.
- Sales Forecasting: A retail store can input past sales data, holiday schedules, and weather forecasts into a regression model to predict exactly how many winter coats they will sell next month, ensuring they don’t overstock or run out.
# Import libraries
import numpy as np
import pandas as pd
from sklearn.model_selection import train_test_split
from sklearn.linear_model import LinearRegression
from sklearn import metrics

# Sample dataset
data = {
    'Area': [750, 800, 850, 900, 950, 1000],
    'Bedrooms': [1, 2, 2, 3, 3, 4],
    'Price': [150000, 180000, 200000, 220000, 250000, 300000]
}

df = pd.DataFrame(data)

# Features and Target
X = df[['Area', 'Bedrooms']]
y = df['Price']

# Split data
X_train, X_test, y_train, y_test = train_test_split(X, y, test_size=0.2)

# Model
model = LinearRegression()
model.fit(X_train, y_train)

# Prediction
y_pred = model.predict(X_test)

# Evaluation
print("Actual:", y_test.values)
print("Predicted:", y_pred)
print("MAE:", metrics.mean_absolute_error(y_test, y_pred))
Evaluation: How Do We Know We Are Right?
When the model makes a prediction, it won’t be perfect. If it predicts a house costs $300,000, and it actually sells for $310,000, the model made an error. We use specific metrics to measure these errors:
- MAE (Mean Absolute Error)
This is the simplest metric. You calculate how far off every prediction was, turn any negative numbers into positive ones (absolute value), and find the average.
- In plain English: “On average, our model’s predictions are off by $10,000.”
- RMSE (Root Mean Squared Error)
This sounds intimidating, but it has a very specific purpose. Before averaging the errors, RMSE squares them (e.g., 10^2 = 100). Because squaring makes large numbers massive, RMSE heavily punishes the model for making really big mistakes.
- In plain English: “We use this when being off by $1,000 is okay, but being off by $50,000 is an absolute disaster.”
- R^2 Score (R-Squared)
Instead of measuring the errors in dollars or units, the R^2 score is like a test grade from 0 to 1 (or 0% to 100%). It compares your sophisticated model to a totally lazy model that just guesses the average price every single time.
- In plain English: An R^2 score of 0.85 means your model explains 85% of the variance in the data. The closer to 1.0, the better!
Summary
Regression algorithms are designed to predict continuous numbers. Linear Regression finds a straightforward “line of best fit,” while Ridge and Lasso Regression help control complexity by shrinking or eliminating less useful features. By evaluating our models with metrics like MAE, RMSE, and R^2, we can tune them to make highly accurate predictions for things like sales, prices, and temperatures.