
Dimensionality Reduction
This is where Dimensionality Reduction, and specifically a technique called PCA (Principal Component Analysis), steps in to save the day.
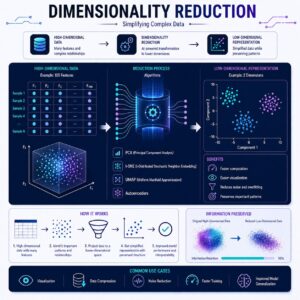
What is Dimensionality Reduction?
Imagine you are holding a 3D object, like a coffee mug, and shining a flashlight on it to cast a shadow on the wall.
The shadow is only 2D. You have mathematically “reduced its dimensions” from 3 to 2. You lost some depth, but by looking at the shadow, you can still easily tell it’s a coffee mug.
In machine learning, a “dimension” is simply a feature (a column in your dataset). Dimensionality Reduction is the process of compressing your data by squishing many columns into fewer columns, while keeping the core “shape” and most important information intact.
Connecting the Dots: Selection vs. Reduction
In our last lesson, we covered Feature Selection which is like looking at your closet and throwing away the clothes you don’t need. You either keep a feature, or you delete it.
Dimensionality Reduction (PCA) is entirely different. It’s like taking a giant suitcase full of clothes and vacuum-sealing it. You aren’t throwing anything away; you are mathematically blending and compressing 100 original features into 10 brand-new, super-dense features. This solves the “Curse of Dimensionality” (which slows down and confuses models) without forcing you to completely abandon the data in the weaker columns.
How PCA Works: Step-by-Step
Principal Component Analysis (PCA) is the most famous dimensionality reduction algorithm. Let’s look at how it works conceptually, without the complex math.
1. Finding the Center
First, PCA plots all your data points on a giant invisible graph. If you have 100 features, this is a 100-dimensional graph (impossible for humans to picture, but easy for computers!).
2. Looking for the “Spread” (Variance)
PCA wants to know where the data is most stretched out. In data science, “spread” equals “information.” If a feature doesn’t change much (everyone has the same value), it’s boring and unhelpful. If it varies wildly, it holds a lot of clues for the model.
3. Drawing the First Line (Principal Component 1)
PCA mathematically draws a straight line through the data points in the exact direction where the data is most spread out. This new line is called Principal Component 1 (PC1).
4. Drawing the Next Lines
Next, PCA draws a second line—perpendicular to the first one—to capture the second largest spread of data. This is PC2. It keeps doing this until it has created new lines for all the dimensions you asked for.
5. The Projection
Finally, PCA abandons your original, messy features. It projects your data points onto these new, clean “Principal Component” lines. You have successfully compressed your data!
A Real-Life Example: The Photographer
Think of PCA like a professional photographer taking a picture of a car.
If you want to capture what the car looks like in a single 2D photograph, you don’t take the picture from perfectly in front of the car (you’d only see the grille and headlights). You don’t take it directly from the side (you wouldn’t see the hood).
Instead, you walk around the car until you find that perfect 3/4 angle where you can see the front, the side, the wheels, and the roof all at once. You capture the maximum amount of “car” in a single flat image. PCA is that photographer. It rotates your data mathematically until it finds the absolute best “angle” to view the most information, and then takes a snapshot.
Practical Use Cases
- Image Compression: A high-resolution photo has millions of pixels (dimensions). PCA can compress this massive grid of pixels into a fraction of the size by keeping only the “principal” patterns. The file size drops dramatically, but to the human eye, the image looks almost identical.
- Genomics (Biology): DNA datasets are massive, often featuring thousands of genes per patient. PCA helps scientists compress these thousands of genes down to just two or three “components.” They can then plot these on a simple 2D graph to easily see if patients naturally cluster together based on a specific disease.
- Financial Modeling: A stock market algorithm might look at 500 economic indicators. PCA can compress these down to 10 broad economic “trends” (like an overall “Tech Sector Health” component or an “Inflation/Interest” component), making it much easier and faster for the model to predict stock prices.
Summary
Feature Engineering isn’t just about building new data; sometimes it is about compressing the data you already have. Dimensionality reduction, via PCA, acts like a vacuum sealer or a master photographer. It squishes and rotates high-dimensional, complex data into a smaller, denser, and faster format. You lose a tiny bit of detail, but you keep the core story, allowing your machine learning models to run efficiently and accurately!