
Hierarchical Clustering
A Simple Definition
Unlike K-Means where you have to guess how many clusters (K) you want from the start, Hierarchical Clustering builds a tree of clusters from the bottom up. It groups the most similar items together, step-by-step, until everything is connected in one giant hierarchy.
Step-by-Step: How It Works
Let’s say you have 5 different animals: a Dog, a Wolf, a Cat, a Lion, and a Shark.
- Start Small: At the beginning, every single animal is its own cluster.
- Find the Closest Pair: The algorithm looks for the two animals that are most similar and merges them. Dog and Wolf become a cluster. Cat and Lion become a cluster.
- Merge Again: Now it looks at the clusters. The Dog/Wolf cluster is fairly similar to the Cat/Lion cluster (they are all mammals). It merges them into a larger “Mammal” cluster.
- The Final Branch: Finally, the Mammal cluster merges with the Shark to form the ultimate “Animal” cluster.
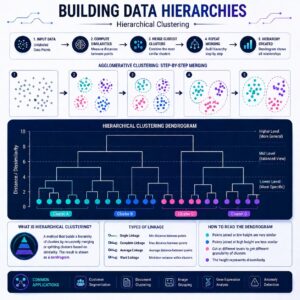
- Draw the Tree: The output is a diagram called a Dendrogram.
The beauty of this is that you can cut the tree wherever you want! If you cut it near the top, you get 2 clusters (Mammals vs. Sharks). If you cut it lower, you get 3 clusters (Canines, Felines, Sharks). You don’t have to guess “K” in advance!
# Import libraries
import numpy as np
import pandas as pd
import matplotlib.pyplot as plt
from scipy.cluster.hierarchy import dendrogram, linkage
from sklearn.cluster import AgglomerativeClustering

# Sample dataset
data = {
    'X': [1, 2, 3, 8, 9, 10],
    'Y': [2, 3, 4, 8, 9, 10]
}

df = pd.DataFrame(data)

# Dendrogram
linked = linkage(df, method='ward')

plt.figure()
dendrogram(linked)
plt.title("Dendrogram")
plt.show()

# Model
model = AgglomerativeClustering(n_clusters=2)
df['Cluster'] = model.fit_predict(df)

print(df)

# Visualization
plt.scatter(df['X'], df['Y'], c=df['Cluster'])
plt.title("Hierarchical Clustering")
plt.show()
Practical Use Cases in the Real World
Both of these algorithms are incredibly powerful for making sense of complex, unlabeled data.
- Customer Segmentation: Imagine you run a global e-commerce site. You have data on millions of customers what they buy, how much they spend, and when they log in. By using K-Means clustering, you can automatically group them into buckets like “Bargain Hunters,” “Weekend Shoppers,” and “High-Value Loyalists.” You can then send tailored discount codes to the Bargain Hunters and exclusive early-access emails to the Loyalists.
- Market Analysis:
If you are a real estate investor trying to find the best neighborhoods to buy property, you can use Hierarchical Clustering. You feed the algorithm data on housing prices, crime rates, school ratings, and proximity to transit. The resulting dendrogram will show you which neighborhoods behave similarly, helping you identify emerging markets that share the exact same DNA as currently expensive neighborhoods.
Summary
To summarize: K-Means is a fast, efficient way to organize data into a specific number of groups by finding central points. Hierarchical Clustering is a more visual approach that builds a “tree” of connections, allowing you to see the relationships between data points without guessing how many groups exist upfront.