
Classification
What is Classification? (A Simple Definition)
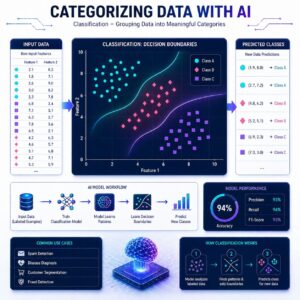
Classification is the process of training a computer to sort data into specific, predefined categories (or “classes”).
If Regression answers the question “How much?”, Classification answers the question “What is it?” or “Which one?”. Because it falls under Supervised Learning, we still train the model using historical data that already has the correct answers (labels) attached.
The Algorithms: How Computers Make Decisions
There are many different ways a computer can learn to classify data. Here are four of the most popular algorithms, ranging from simple to highly advanced:
1. Logistic Regression
Don’t let the name fool you! Even though it has “regression” in the title, it is strictly used for classification.
- How it works: Instead of predicting a specific number, it predicts a probability between 0 and 1.
- Example: If it’s looking at an email, it might calculate an 85% probability that the email is spam. If you set your threshold at 50%, the model will classify anything above that line as “Spam” and anything below as “Not Spam.”
2. Decision Tree
- How it works: This algorithm builds a giant flowchart based on a series of “Yes/No” questions.
- Example: Imagine trying to classify an animal. The tree might ask, “Does it have fur?” (If yes, go left). “Does it bark?” (If yes, go left). “It’s a Dog!” It splits the data over and over based on the features until it reaches a final category.
3. Random Forest
- How it works: A single Decision Tree can sometimes memorize the training data too well and make weird mistakes (overfitting). A Random Forest solves this by creating a whole “forest” of hundreds of different decision trees.
- Example: When new data comes in, every single tree in the forest makes a guess. The forest then holds a vote, and the category with the most votes wins. It relies on the wisdom of the crowd!
4. K-Nearest Neighbors (KNN)
- How it works: This algorithm operates on the idea that “birds of a feather flock together.” It plots all the training data on a graph. When you give it a new, unclassified data point, it looks at the “K” closest neighbors to that point.
- Example: If we set K to 5, the model looks at the 5 nearest dots on the graph. If 4 of them are “Apples” and 1 is a “Tomato,” the algorithm classifies the new point as an “Apple.”
Practical Use Cases
Classification is arguably the most common type of machine learning used in business today:
- Spam Detection: Email providers use classification to instantly decide if an incoming message belongs in your Inbox or your Junk folder based on the sender and the words used.
- Fraud Detection: Banks classify credit card swipes in real-time. If a card normally used for groceries in New York is suddenly used to buy a $5,000 TV in Paris, the model flags it as “Fraud.”
- Customer Churn Prediction: “Churn” is a business term for when a customer cancels their subscription. Streaming services use classification to identify which users are likely to cancel next month so they can send them special discount offers to stay.
# Import libraries
from sklearn.datasets import load_iris
from sklearn.model_selection import train_test_split
from sklearn.linear_model import LogisticRegression
from sklearn.metrics import accuracy_score

# Load dataset
data = load_iris()
X = data.data
y = data.target

# Split data
X_train, X_test, y_train, y_test = train_test_split(X, y, test_size=0.2)

# Model
model = LogisticRegression(max_iter=200)
model.fit(X_train, y_train)

# Prediction
y_pred = model.predict(X_test)

# Evaluation
print("Predicted:", y_pred)
print("Accuracy:", accuracy_score(y_test, y_pred))
Evaluation: Beyond Just “Accuracy”
When grading a classification model, your first instinct might be to just look at Accuracy (the percentage of total correct guesses). But Accuracy can be a trap!
Imagine a bank where 99% of transactions are normal and 1% are fraud. A terrible, lazy AI could just guess “Normal” every single time. It would be 99% accurate, but it would miss 100% of the fraud! To get a true picture of how well a model is doing, we use a grid called a Confusion Matrix and three special metrics.
The Confusion Matrix
This is a 2×2 grid that breaks down the model’s guesses into four categories:
- True Positives (TP): It predicted Fraud, and it was Fraud. (Great!)
- True Negatives (TN): It predicted Normal, and it was Normal. (Great!)
- False Positives (FP): It predicted Fraud, but it was Normal. (False Alarm!)
- False Negatives (FN): It predicted Normal, but it was Fraud. (The worst mistake!)
From this grid, we calculate our true performance:
- Precision (Quality of the Alarm)
- Question: “When the model cries wolf, is there actually a wolf?”
- Out of all the times the model predicted “Fraud,” how many were actually fraud? High precision means very few false alarms.
- Recall (Catching the Bad Guys)
- Question: “Out of all the actual wolves, how many did we catch?”
- Out of all the actual fraud in the dataset, how much did the model successfully find? High recall means you aren’t missing the bad guys, even if it means triggering a few false alarms.
- F1 Score
Precision and Recall are a tug-of-war. If you increase one, the other usually drops. The F1 Score combines both of them into a single, balanced number so you can easily compare two different models.
Summary
Classification algorithms like Logistic Regression, Decision Trees, Random Forests, and KNN teach computers to categorize data into distinct groups. Because simple accuracy can be misleading (especially in fields like fraud or disease detection), we use a Confusion Matrix to calculate Precision, Recall, and the F1 Score, giving us a much clearer picture of exactly how our model is making mistakes.